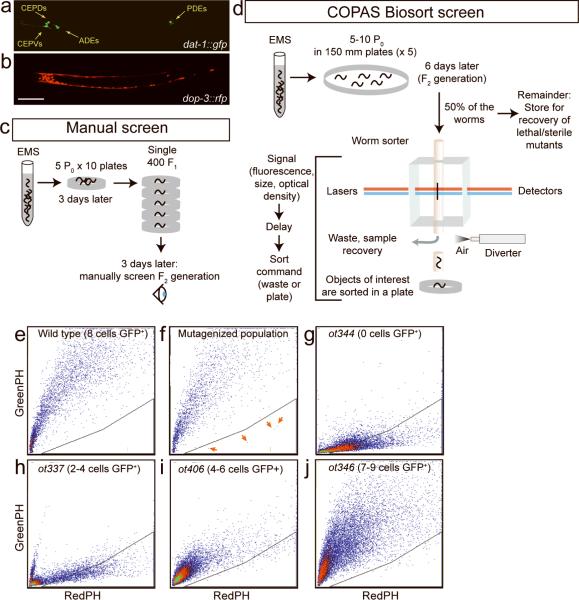
Figure 1. Screening for dopaminergic cell fate mutants.
(a, b) Transgenic strains used for the worm sorter screen. Scale bar represents 100 μm. (c) Experimental procedure of the manual screen. (d) Experimental procedure of the COPAS worm sorter screen. (e)-(j) Relative fluorescence intensity plots between red and green channels of sorted worms. Scale is defined by the sorting parameters (see Supplementary Methods). Each dot corresponds to a single worm. (e) Profile of a non-mutagenized population of the sorting strain. (f) Example profile of a mutagenized population of worms. Red arrows indicate individual animals that fall into the manually-set sorting window. (g-j) Profiles of homogenous populations of retrieved mutants: (g) ot344 (0 out of 8 cells expressing gfp), (h) ot337 (2-4 out of 8 cells expressing gfp), (i) ot406 (4-6 out of 8 cells expressing gfp), and (j) ot346 (7-9 out of 8 cells expressing gfp). The triangle area at the bottom right of each panel is an example of a sorting region chosen to demonstrate the profile differences between various populations. The actual sorting region used in the screening process was usually larger, to minimize the possibility of loosing mutants.

