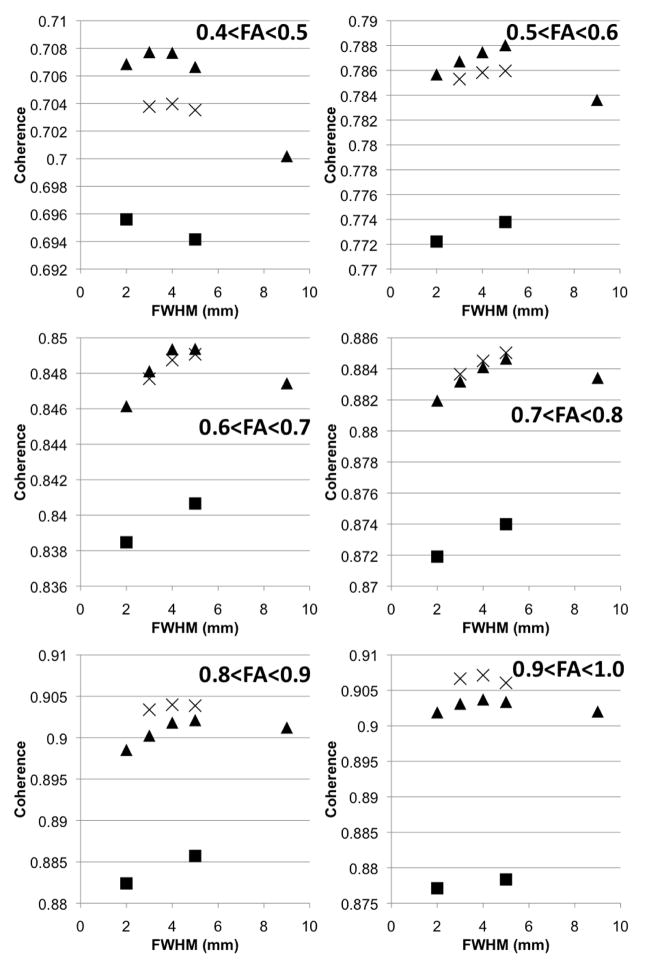
Figure 2.
Graphs of the average coherence of primary eigenvectors in white matter as a function of the smoothing size, for different normalization approaches and different FA values. Squares correspond to normalization using only mean DW information, triangles to mean DW and FA information, and X’s to mean DW, FA and trace information. Error bars representing the standard deviation of coherence for each range of FA values were not included, since they would overlap with each other and complicate the graph. Instead, the standard deviations for normalization using mean DW and FA information and smoothing with FWHM=4mm were included in Table 6. The standard deviations for other normalization approaches were almost equal to those shown in Table 6.

