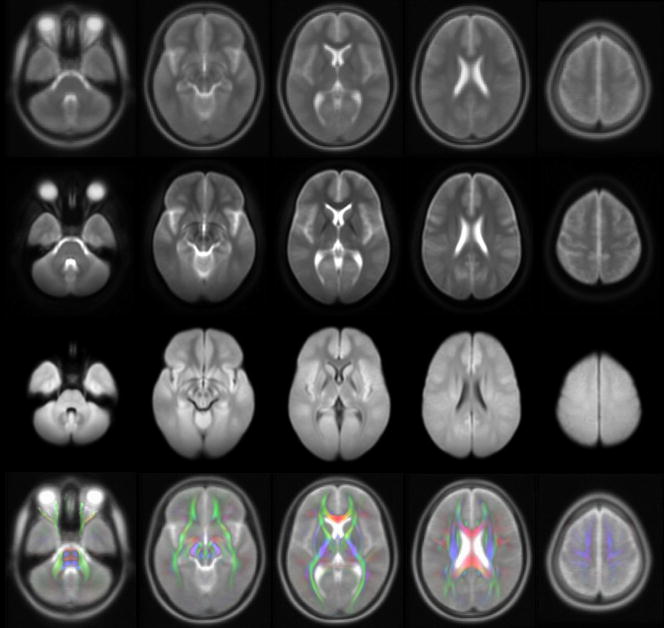
Figure 4.
Axial images from the ICBM-152 T2-weighted brain template (top row), and the corresponding mean b=0sec/mm2 (second row) and mean DW (third row) maps over all 67 participants. The bottom row contains overlays of the diffusion anisotropy color maps derived from the IITmean template on ICBM-152 T2-weighted images.

