
Figure 3.
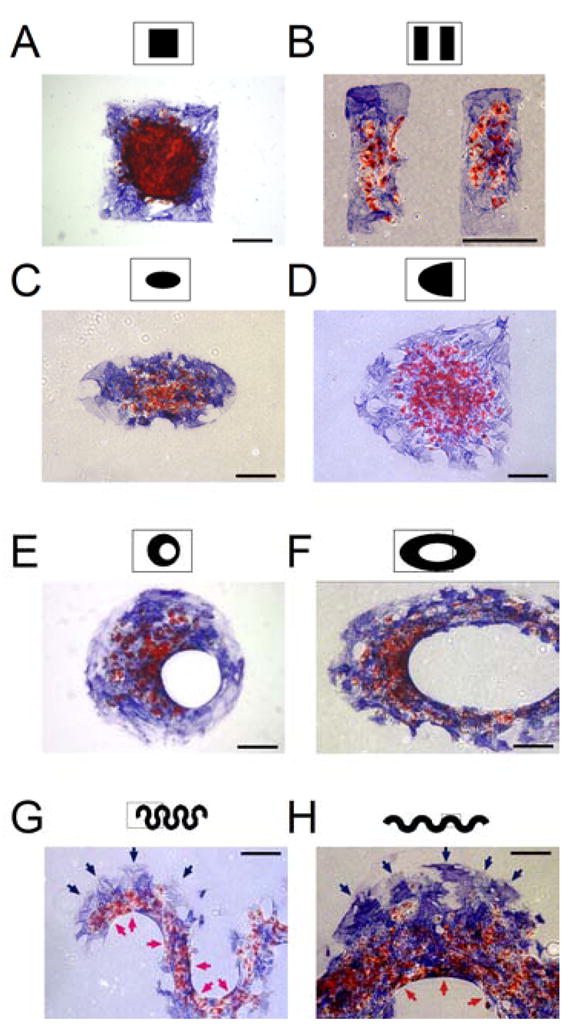
Geometry determines spatial patterning of differentiation. (A–H) MSC aggregates in the shape of a square (A), rectangles (B), an ellipse (C), a half-ellipse (D), an offset annulus (E), an elliptical annulus (F), and sinusoidal bands (G,H) stained for oil droplets (red) and alkaline phosphatase (blue) after 14 days in mixed media. Red arrows indicate adipogenesis at concave edges and blue arrows indicate osteogenesis at convex edges. All Scale bars indicate 250 μm.