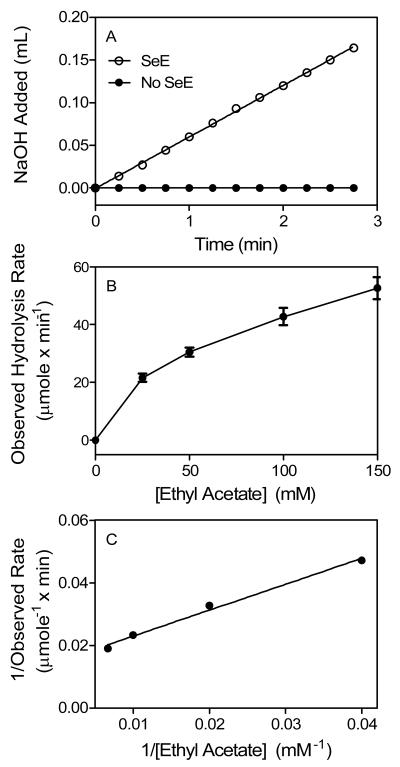
Fig. 1.
SeE-catalyzed hydrolysis of ethyl acetate. (A) Titration of the released acetic acid with 0.02 N NaOH in a reaction of 25 mM ethyl acetate in the absence (solid circles) or presence (open circles) of 52 μg SeE in 25 ml of 2 mM Tris-HCl buffer pH 7.6 at 25°C using a pH-stat. Presented is the accumulative volume of NaOH added as a function of time. (B) Plotting of hydrolysis rate versus ethyl acetate concentration. The rates were calculated from the slope of the curve in panel A and similar experiments at the other ethyl acetate concentrations. (C) Double reciprocal plotting of the data in panel B.

