
Figure 4.
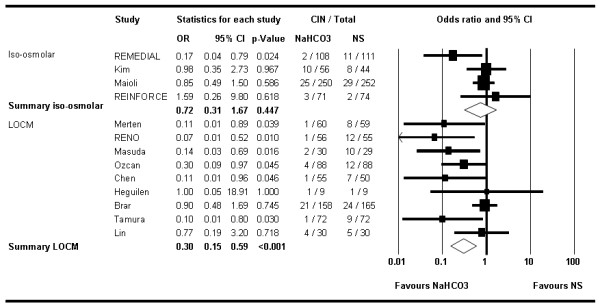
Forest plot of stratified analysis by studies using iso-osmolar (iodixanol) versus low-osmolar contrast media. Sizes of data markers are proportional to the weight of each study in the meta-analysis. Horizontal bars, 95% confidence interval.