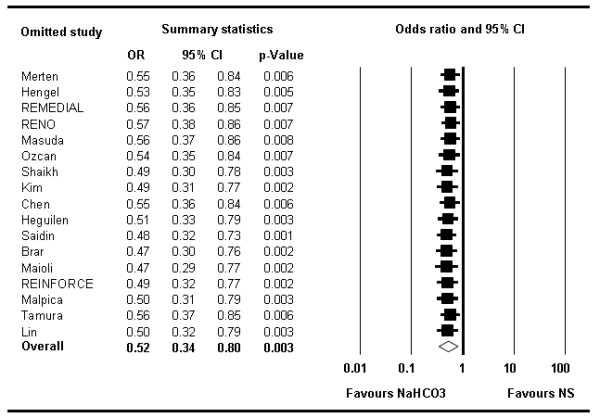
Figure 7.

Forest plot of odds ratios illustrating the influence of single trials on the overall analysis. Each row represents an overall estimate of odds ratios when omitting one study (left column represents name of omitted study). The lowest row shows the overall odds ratio when all studies are included. No particular study relevantly influences the overall odds ratio. Horizontal bars, 95% confidence interval. NaHCO3 = sodium bicarbonate; NS = normal saline.
