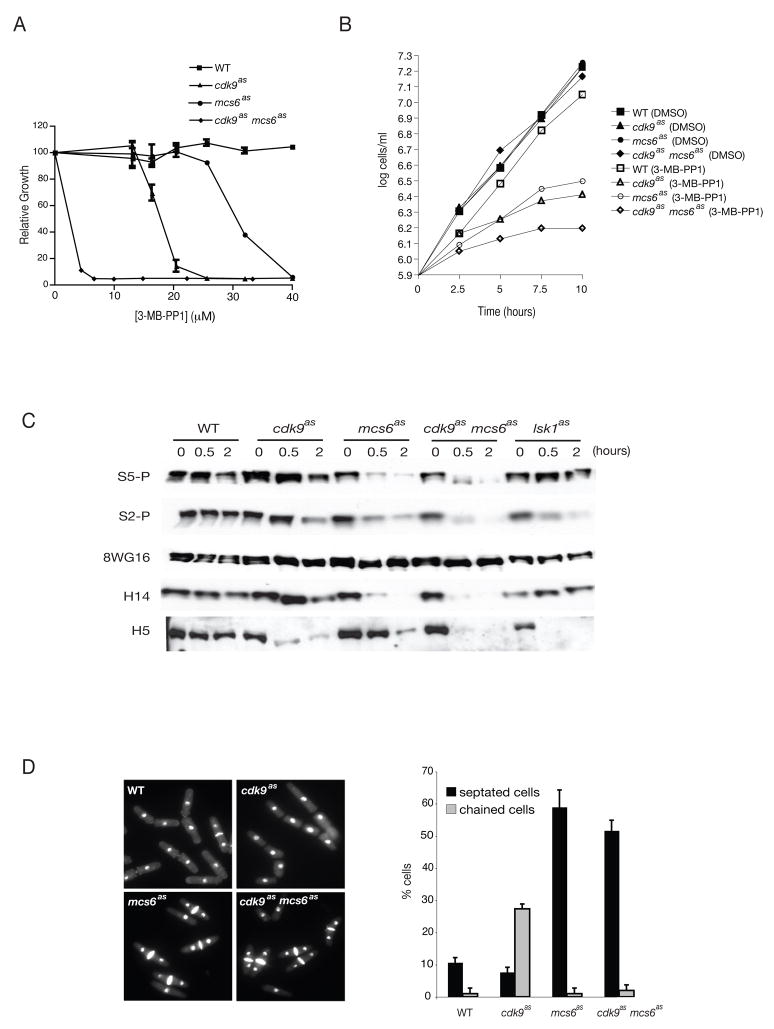
Figure 1. Phenotypes of mcs6as and cdk9as Cells.
(A) Dose response of wild-type (JS78), cdk9as (LV7), mcs6as-3HA (SG2) and cdk9as mcs6as-3HA (LV42) strains to 3-MB-PP1. Cells were grown in 96-well microtitre dishes with indicated concentrations of inhibitor. Absorbance was measured and plotted relative to that of DMSO-treated cells of the same genotype (defined as 100%). Error bars denote standard error of mean (S.E.M) in triplicate measurements.
(B) Exponential growth curves of strains in (A), in rich medium to which 40 μM 3-MB-PP1 or DMSO, as indicated, was added at time 0.
(C) Time course of changes in Pol II phosphorylation after CDK inhibition. Exponentially growing cells of strains in (A) plus lsk1as (CS118) were collected before adding inhibitor (time 0), and after 0.5- and 1-hr treatments with 40 μM 3-MB-PP1. Extracts were immunoblotted with indicated antibodies: P-Ser5, P-Ser2, 8WG16, H14 and H5.
(D) Micrographs of indicated strains fixed and stained with 4′,6-diamidino-2-phenylindole and calcofluor after 10 hr in 40 μM 3-MB-PP1. Percentages of cells with septa, or attached in chains of three or more, were measured in triplicate with S.E.M denoted by error bars.

