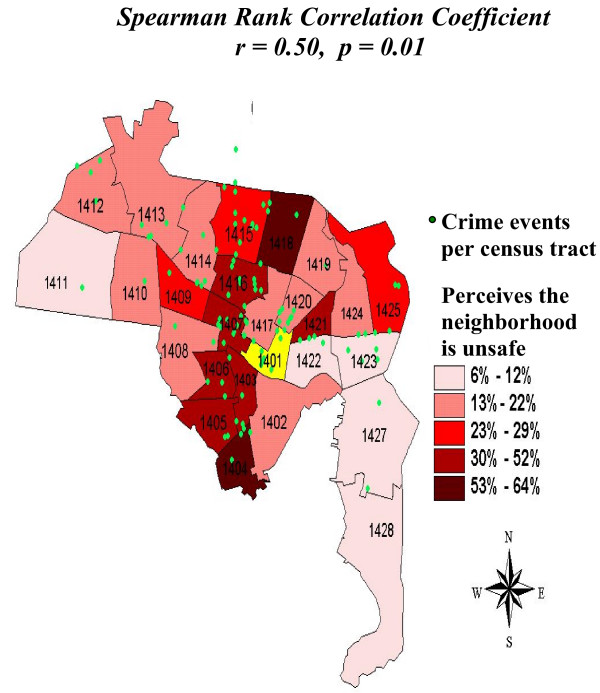
Figure 1.
Percentage of residents who believe the neighborhood is unsafe due to crime. Displays percentage of New Haven EPESE participants who perceived their neighborhood was unsafe due to crime in 1982. Green overlay represents crime events per census tract in 1982. Neighborhoods are measured as individual census tracts. Census tracts are numbered 1401–1428. Tract 1401 = Central Business District. Source data: (1) New Haven Established Populations for Epidemiologic Studies of the Elderly (EPESE) 1982. (2) New Haven Register crime event reports for year 1982.

