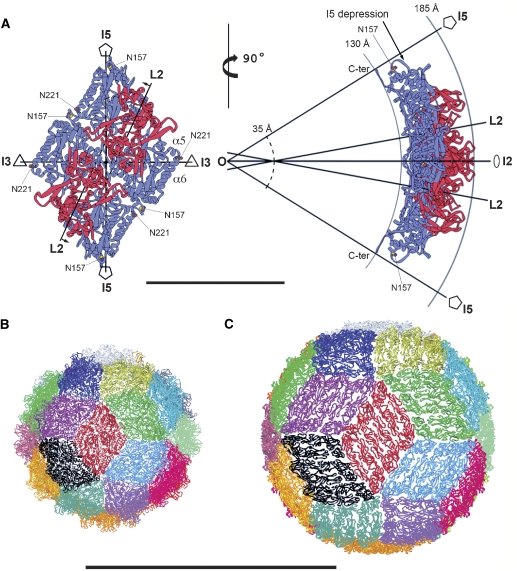
Figure 3.
Parallel dimers define the outline of a rhombus-shaped tile on the icosahedral particle. (A) Two CP dimers related by an I2 axis of the particle are displayed as ribbons, with the S and P domains coloured blue and red, respectively. The nearest icosahedral and local symmetry axes are drawn in projection and labelled. The left panel is projected down the I2 axis. The L2 axes make an angle of about 11.5 degrees with the I2 axis and do not intersect each other, but lie in parallel planes perpendicular to the paper; small arrows by the L2 labels indicate the direction and length (6.2 Å) of the translation needed to bring these planes into coincidence with a parallel vertical plane containing the I2 axis. The right panel shows an orthogonal view rotated about a vertical axis. Full-line arcs indicate the inner and outer radii of the particle (labelled), highlighting the curvature of the diamond tile. The L2 axes cross the vertical plane containing the I2 axis (which is in the plane of the paper) along a vertical line, at a distance of 14.5 Å from each other, above and below the I2 axis. This vertical line intersects the I2 axis at a radius of about 35 Å (broken line arc), indicating a sharper local curvature at the I2 contact than that of the overall particle. The particle centre is indicated by O, where I5, I3 and I2 axes intersect. Residues Asn 157 and Asn 221 are displayed as yellow and red spheres and labelled, as well as helices α5 and α6 mentioned in the text. C-ter labels the last four amino acids of chain A (587–590, disordered in chain B) running along the I5 axis. Bar: 100 Å. (B). Triacontahedral design of the PBV particle, each of the 30 rhombic tiles is coloured differently. The red tile is oriented as the one displayed in the top panel. (C) Convergence with the icosahedral organization with the flavivirus particle, where each of the 30 tiles (coloured as in B) is composed of 3 parallel dimers of the envelope protein. Coordinates obtained from PDB entry 1THD. Panels B and C are at the same scale. Bar: 500 Å.

