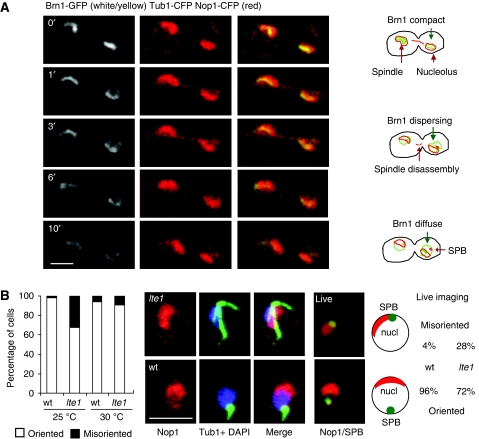
Figure 7.
Nuclear organization is altered in the lte1 mutant. (A) The wt strain GA-3330 (CFP-TUB1, BRN1-GFP, pNOP1-CFP) was grown at 30°C and analysed by time-lapse microscopy. Cells were recorded from late mitosis to G1 and merged images are on the right. Schemes illustrate Brn1 unloading, and the repositioning of the nucleolus and SPB. Bar=2 μm. (B) GA-180 (wt) and GA-3327 (lte1Δ) cells were grown at 30°C and incubated at 25°C before fixation for IF for Nop1 (red), tubulin (green) and DAPI. The graph shows the percentage of cells with G1 asters and oriented (□) or misoriented (▪) nuclear architecture. In addition, strains GA-3330 (TUB1-GFP pNOP1-CFP) and GA-3596 (lte1Δ TUB1-CFP pNOP1-CFP) were analysed by live microscopy (Tub1-GFP, green; Nop1-CFP, red). 100 cells were scored for misoriented or oriented nucleolus, as indicated. Bar=5 μm.

