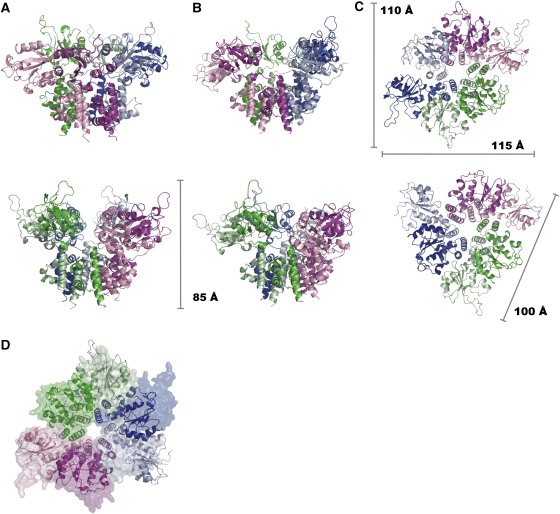
Figure 3.
Cartoon representations of the C2- and C3-structures of the RepB6 in different orientations, indicating the dimensions. Shown are distinct side views on the (A) C2- and (B) C3-structures. (C) View on the OBDs along the local axis of the C2 (top)- and C3 (bottom)-structures. (D) shows the superposition of the two structures, where C2 is represented by a molecular surface and C3 by ribbons.

