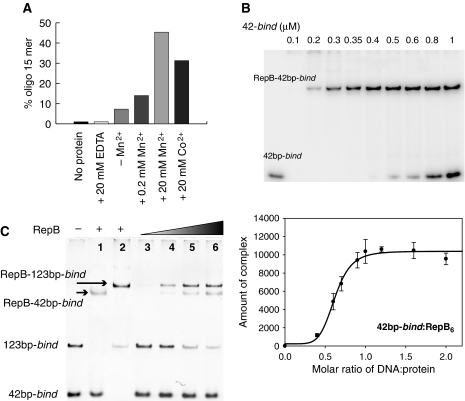
Figure 5.
DNA cleavage by RepB and stoichiometry of binding of RepB to the bind locus. (A) RepB-mediated cleavage of a 23-mer ssDNA containing the nick sequence in the presence of Mn2+ or Co2+. The cleavage activity is represented as the percentage of the reaction product (15-mer). A small basal cleavage level (∼5%) due to the presence of trace amounts of metal ions was abolished by the addition of 20 mM EDTA. (B) Electrophoresis gel (top) and a plot of the amount of complex (integrated peak area in arbitrary units) as a function of the DNA:protein ratio (bottom) obtained from the EMSA experiment. (C) EMSA analysis of complexes generated on addition of RepB to a mixture of the 42bp-bind and 123bp-bind DNAs. Positions of the free DNAs and of the RepB–DNA complexes are indicated. Lanes 1 and 2 show the complexes generated by binding of RepB to the separate fragments. RepB6 concentrations were: 0 (—), 0.35 (lanes 1, 2 and 5), 0.17 (lane 3), 0.25 (lane 4) and 0.44 (lane 6) μM.

