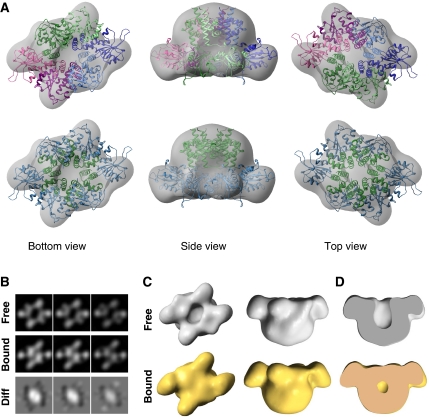
Figure 6.
EM structure of RepB and DNA-bound RepB. (A) Several views of the 3D reconstruction of RepB6 (grey surface) superposed on the C2 X-ray structure. Top panels show the atomic model using a different colour for each protomer, whereas bottom panels display the same view coloured by domain (OD in green and OBD in blue). (B) Sectional views of the RepB and DNA-bound RepB reconstructions showing the crevice and channel. Bottom panel displays equivalent sections for the difference map of these two structures. (C) Comparative views of the 3D-structures of RepB (top, grey solid surfaces) and DNA-bound RepB (bottom, gold solid surfaces). (D) Cut view of the bound and unbound RepB structures. All 3D density maps were rendered with UCSF Chimera (Pettersen et al, 2004).

