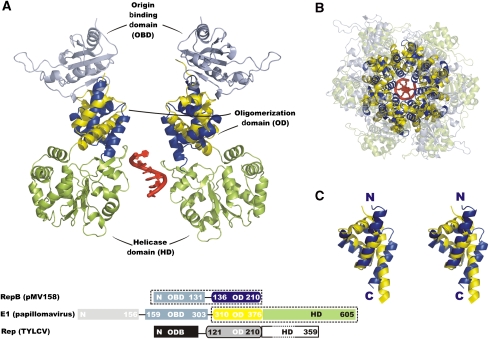
Figure 7.
Comparison of the RepB and papillomavirus E1 helicase structures. The lower box diagram shows the alignment and domain organization of the full-length primary sequence of RepB, E1 and TYLCV Rep. Dashed boxes indicate the domains included in the figure, where the colouring of the domain diagram corresponds to the structure representations. The DNA fragment passing through the E1-structure is shown in red. (A) Superposition of two channel-flanking monomers of the hexamers of RepB and E1. The DNA fragment from the E1-structure is shown in red. (B) Top view of the superposition including all protomers of both structures, with the below-plane C-terminal domains of E1 and the above-plane N-terminal domains of RepB shown as transparent cartoon representations. (C) Stereo view of the superposition of the ODs of both structures showing the similarity in fold.

