Figure 1.
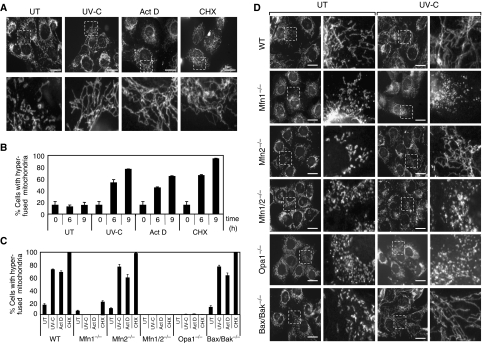
Mitochondrial tubulation in response to stress stimuli requires Opa1 and Mfn1. (A, B) Wild-type MEFs after exposure to 60 mJ/cm2 UV-C, 3 μg/ml Act D or 10 μM CHX. (A) MEFs stained with antibodies to cytochrome c were analyzed in untreated conditions and 9 h after stress exposure by fluorescence microscopy. Scale bar, 25 μm. (B) Quantification of cells with a majority of connected, very long (>5 μm) tubular mitochondria the extremities of which are difficult to visualize (defined as hyperfused mitochondria) at the indicated time points after stress exposure. Data represent the mean±s.d. of three independent experiments, each with >300 cells counted per condition. (C, D) Wild type, Mfn1−/−, Mfn2−/−, Mfn1/2−/−, Opa1−/−, and Bax/Bak−/− MEFs after exposure to UV-C irradiation. (C) Quantification of cells with hyperfused mitochondria 9 h after exposure with 60 mJ/cm2 UV-C, 3 μg/ml Act D, or 10 μM CHX. Data represent the mean±s.d. of three independent experiments, each with >300 cells counted per condition. Wild-type MEFs shown here are controls for Mfn1−/− cells and are representative of all WT MEFs used as controls for mutant MEFs. (D) MEFs stained with antibodies to cytochrome c were analysed in untreated conditions and 9 h after UV-C irradiation by fluorescence microscopy. Scale bar, 25 μm.

