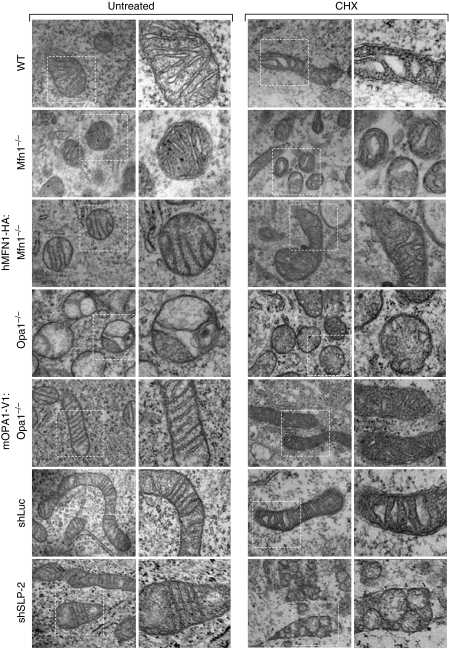
Figure 6.
SIMH is associated with ultrastructural changes. Ultrastructural analysis of WT, Mfn1−/−, hMFN1-HA:Mfn1−/−, OPA1−/−, mOPA1-V1:OPA1−/−, shLuc, and shSLP-2 MEFs. Cells were untreated (left part) or exposed to 10 μM CHX (right part) and fixed after 6 h for electron microscopy analysis. Scale bar, 1 μm.

