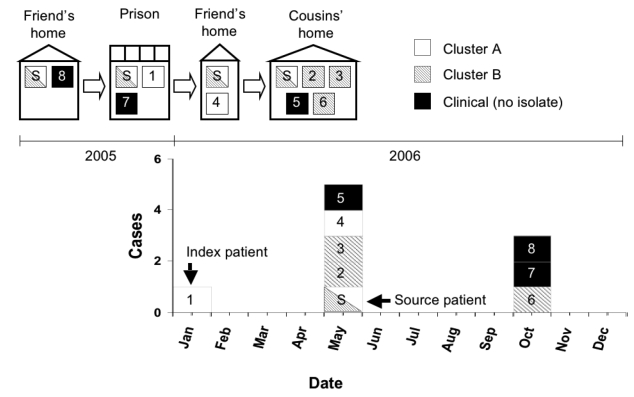
Figure.
Living arrangements of source patient and secondary patients and tuberculosis cases by month and year of diagnosis, January 2005–December 2006 (n=9)a
aPatients are numbered in order of diagnosis.
Legend: white bar = patients in Cluster A; shaded bar = patients in Cluster B; black bar = patients with clinical tuberculosis (no isolate available)
S = source patient

