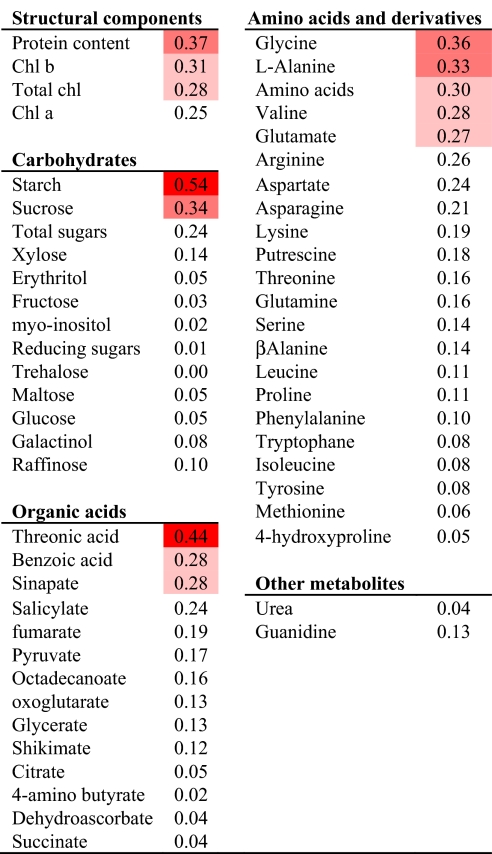
Table 1.
Spearman coefficients of metabolic traits against biomass
Correlations were calculated from mean data. Significant correlations at P < 0.00001, P < 0.001, and P < 0.01 are indicated by dark, medium, and light shading. Blue and red distinguish positive and negative correlations, respectively. The original data are in Table S1.

