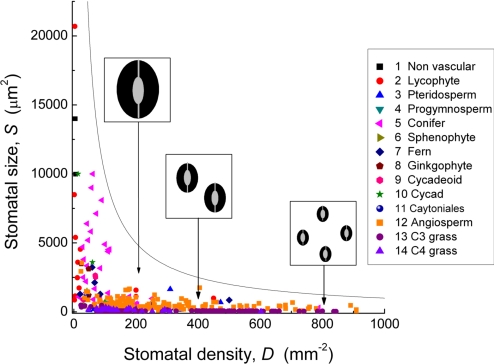
Fig. 1.
The relationship between stomatal size S and density D across the Phanerozoic. Each point is an individual species (see Table S1). The curved line is the estimated upper theoretical limit to stomatal size at a given density, or the upper limit of density at a given size. All combinations of size and density must fall below this line. Diagrams in boxes are comparative representations of possible combinations of stomatal size and density to assist visualization of the scaling of these dimensions in real leaves.

