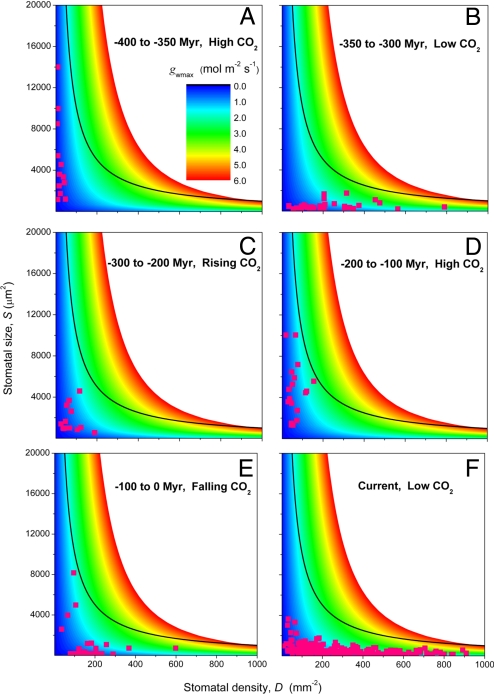
Fig. 5.
Distinct modes of stomatal trait evolution. Graduations in gwmax for multiple combinations of S and D are represented by color contours. The curved black line represents the theoretical upper limit of S versus D. Note that gwmax at this limit increases with D, even though S decreases. Stomatal conductances attainable at small S and high D are theoretically unattainable at much larger S and lower D (red area), even though total pore area per unit leaf area is constant. Overlaid on this surface are data (pink symbols) for S and D from fossil plants, showing the predominance of smaller S and higher D in times of falling atmospheric CO2 concentration.

