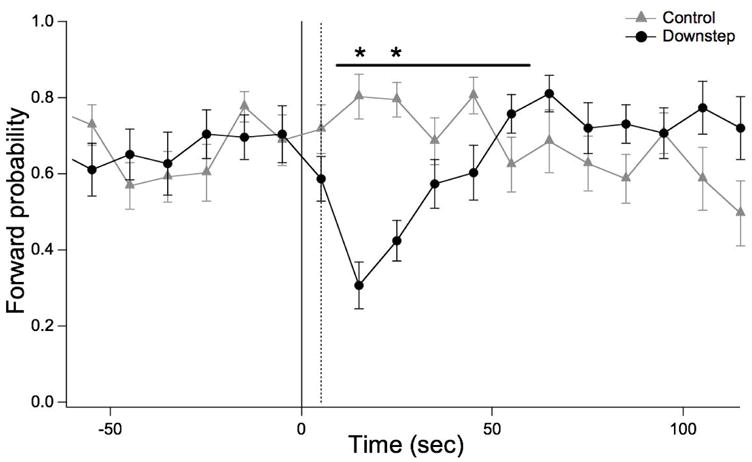
Figure 4.

Sodium chloride step-response behavior in the artificial soil device. The probability of forward crawling is plotted versus time in 10 sec bins. Perfusion was switched from Reservoir A to Reservoir B (see Fig. 1) at t = 0. The dashed line shows the time at which the front of Solution B reached the center of the device, as determined in separate experiments using food dye. In the Downstep group (20 worms), NaCl concentrations in Reservoir A and B were 100 mM and 1 mM respectively. In the Control group (20 worms), both solutions were 100 mM NaCl. Statistics. ANOVA in the window indicated by the horizontal bar: main effect of treatment, F(1,38), p < 10−5. Asterisks: Post-hoc t-tests after Bonferroni correction, p < 0.05.
