
Figure 1. Generation of Mice with Graded Reduction in RanBP2 Dosage.
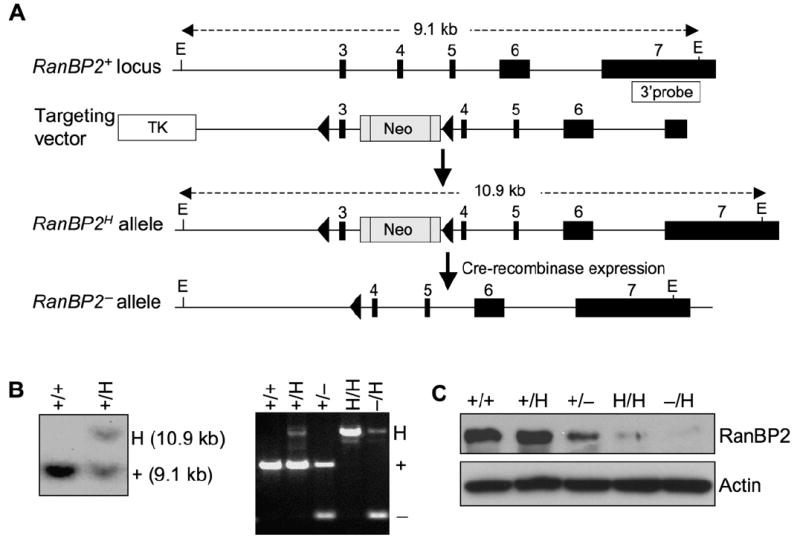
(A) Schematic representation of the RanBP2 gene targeting strategy. The relevant portion of the RanBP2 locus, the targeting vector with loxP (triangles), the hypomorphic and knockout alleles, and the EcoRV restriction sites (E) and the probe used for Southern blotting are indicated.
(B) (left) Southern blot analysis of RanBP2+/H and RanBP2+/+ mice. (Right) PCR-based genotype analysis of RanBP2 mutant mice.
(C) Western blot analysis of MEFs isolated from mice carrying the indicated RanBP2 alleles using anti-RanBP2 antibody. Actin was used as a loading control.