
Figure 2. Cells with Low Levels of RanBP2 Form Chromosome Bridges in Anaphase.
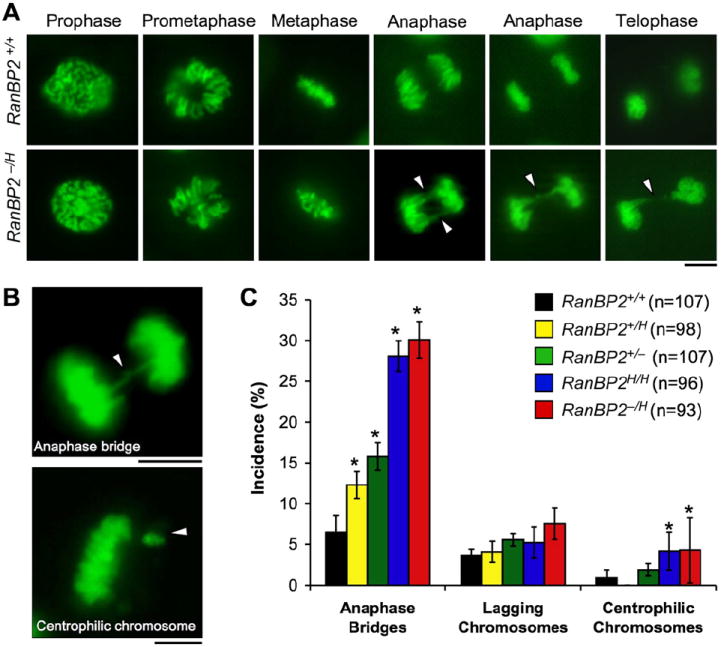
(A) Chromosome dynamics and segregation of RanBP2+/+ and RanBP2−/H MEFs expressing H2B-YFP were observed by timelapse microscopy. Representative images of each mitotic stage are shown. Arrowheads mark chromatin bridges in RanBP2−/H MEFs. Bar = 10 μm.
(B) High-magnification images of RanBP2−/H MEFs with indicated chromosome segregation defects. Bar = 10 μm.
(C) Quantification of the chromosome segregation defects observed by live-cell imaging of MEFs of the indicated genotypes. n = total number of mitotic cells analyzed from at least three independent MEF lines. Error bars indicate SEM, *p < 0.05 versus wild-type cells (Chi-square test).