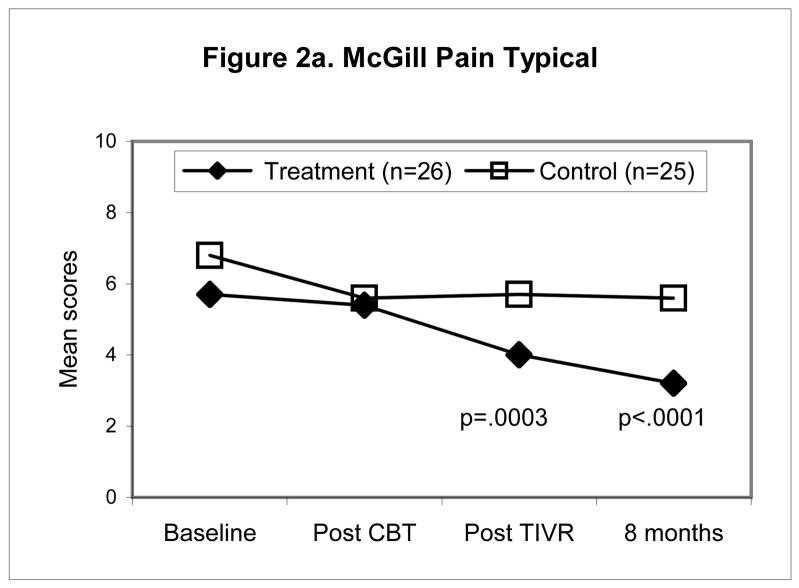
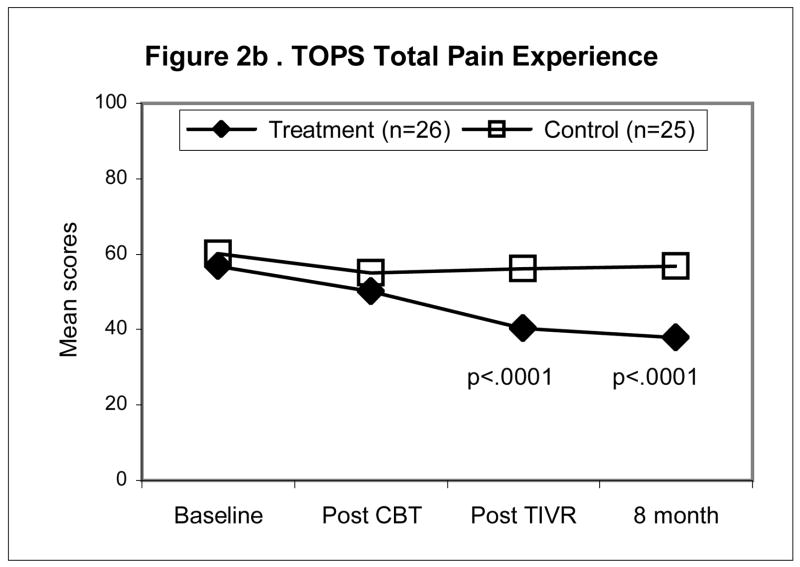
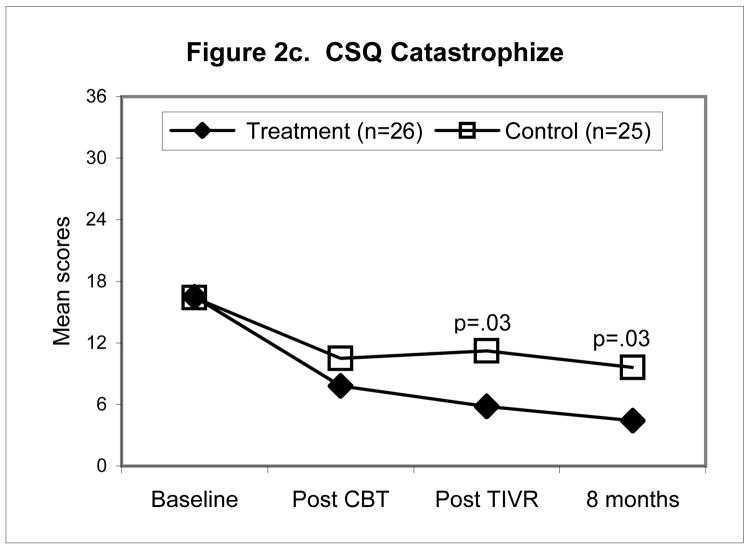
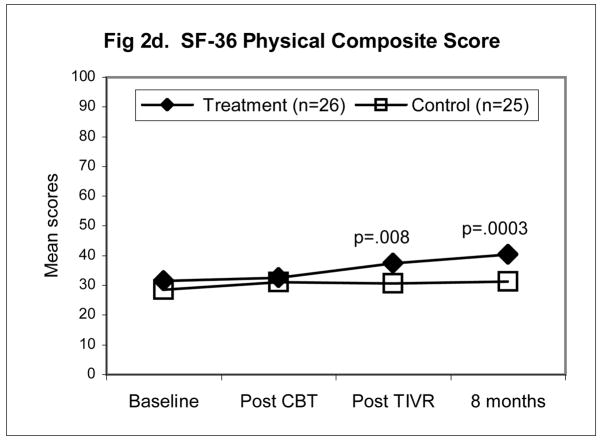
Figure 2.
Mean scores for the control and TIVR groups at four time points. The two groups’ scores were similar at post-CBT but became significantly different by the end of the TIVR intervention and more so by the last follow-up since the TIVR group continued to improve. The p-values are reported for the between-group comparisons, adjusted for post-CBT differences (ANCOVA), at the last two assessments.


