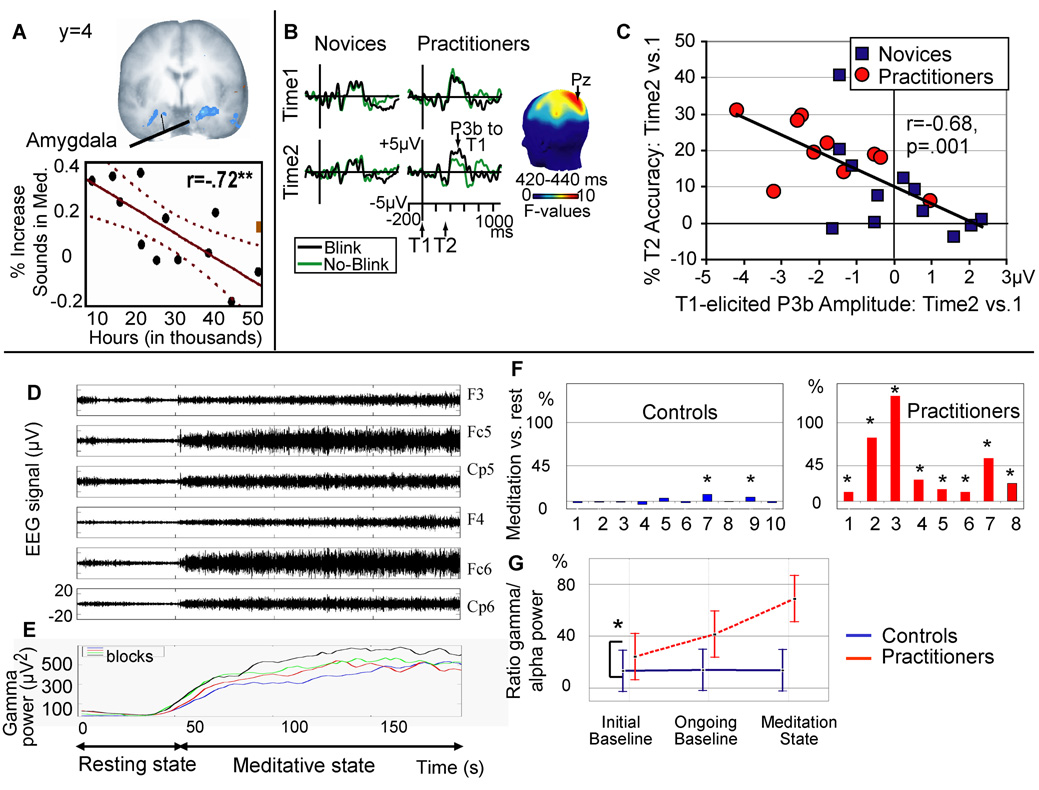
Figure 1. Neuroimaging and neurodynamical correlates of FA and OM meditations.
(a).Relationship between degree of meditation training (in years) and hemodynamic response in the amygdala (in blue) to distractor sounds during FA meditation in long-term Buddhist practitioners. Individual responses in the right amygdala are plotted (adapted from 27). (b) illustrates the reduction in P3b amplitude, a brain-potential index of resource allocation, to the first of two target stimuli (T1 and T2) presented in a rapid stream of distracter stimuli after three months of intensive Vipassana meditation (48). Shown are scalp-recorded brain potentials from electrode Pz, time-locked to T1 onset as a function of T2 accuracy (detected (no-blink) vs. not detected (blink)), time (before or after three months), and group (practitioners vs. novices). The scalp map shows electrode sites where this three-way interaction was significant between 420 and 440ms. (c) shows that generally, the greater the reduction in brain-resource allocation to T1 was over time, the better able an individual became at accurately identifying T2 (adapted from 48). (d–e) Example of high-amplitude gamma activity during a form of OM meditation, non-referential compassion meditation, in long-term Buddhist practitioners (56). (d) Raw electroencephalographic signals. At t = 45 s, practitioner S4 started meditating. (e) Time course of gamma (25–42 Hz) activity power over the electrodes displayed in (d) during four blocks computed in a 20-s sliding window every 2 s and then averaged over electrodes. (f) Intra-individual analysis on the ratio of gamma to slow oscillations (4–13 Hz) averaged across all electrodes during compassion meditation. The abscissa represents the subject numbers, the ordinate represents the difference in the mean ratio between the initial state and meditative state, and the black and red stars indicate that this increase is greater than two and three times, respectively, the baseline standard deviation. (g) illustrates the significant interaction between group (practitioner, control) and state (initial baseline, ongoing baseline, and meditation state) for this ratio. The relative gamma increase during meditation was higher in the post-meditation session. In the initial baseline, the relative gamma was already higher for the practitioners than the controls and correlated with the length of the long-term practitioners' meditation training through life (adapted from 56). For all further details regarding methods and analysis of these studies, see papers cited.

