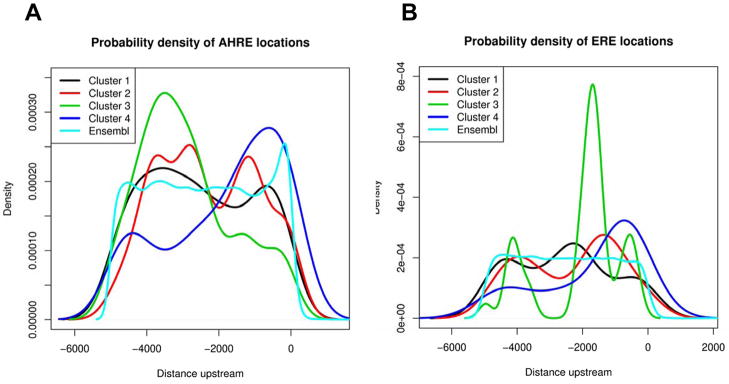
Figure 5.
Probability density curves illustrate the potential location bias of putative AHREs (A) and EREs (B) with respect to the translational start site for the transcripts within each hierarchical cluster compared with reference. Note: Probability density curves represent the probability distribution in terms of integrals, illustrated as a line depicting the relative frequency that each response element is represented at that location.

