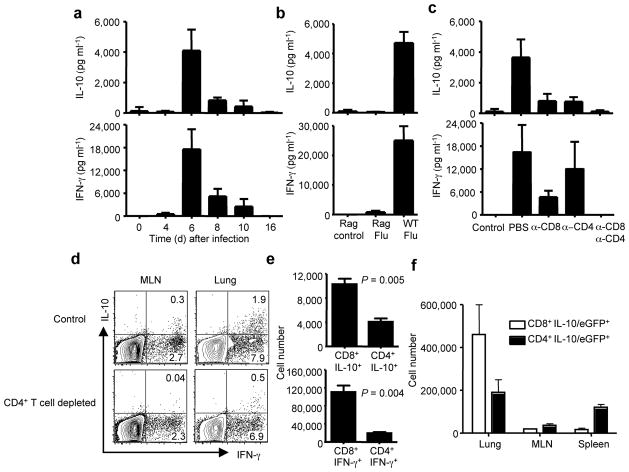
Figure 4. Te are the major source of IL-10 in vivo during influenza infection.
BALB/c mice were infected with influenza (a–e). (a) At the indicated days p.i., IL-10 and IFN-γ levels in the BALF were measured by ELISA. (b) WT and Rag1−/− mice were infected with influenza. At day 6 p.i., IL-10 and IFN-γ levels in the BALF were measured by ELISA. Rag control (Rag1−/− mice uninfected), Rag Flu (Rag1−/− mice infected with influenza), WT Flu (WT mice infected with influenza). (c) At day 6 p.i., IL- 10 and IFN-γ levels in the BALF were measured by ELISA. Control (uninfected mice), PBS (mice injected with PBS), α-CD8 (mice injected with CD8-specific mAb), α-CD4 (mice injected with CD4-specific mAb), α-CD8/α-CD4 (mice injected with CD8-specific plus CD4-specific mAbs). (d) At day 6 p.i., lung and MLN cells from control or CD4+ T cell depleted mice were restimulated in vitro with influenza-infected BMDC and ICS was performed to measure the production of IL-10 and IFN-γ in gated CD8+ T cells. Numbers indicate the percentages of cytokine-positive cells in the gates within the total population. (e) At day 6 p.i., mice were injected with monensin and the in vivo ICS assay was performed to measure the production of IL-10 and IFN-γ by CD8+ and CD4+ T cells in the lung in vivo. The numbers of IL-10+ CD8+, IL-10+ CD4+, IFN-γ+ CD8+ and IFN-γ+ CD4+ T cells are depicted. P values were determined by unpaired two-tailed student t test. (f) IL-10/eGFP reporter mice were infected with influenza. At day 6 p.i., the numbers of IL-10/eGFP+ CD8+ and IL-10/eGFP+ CD4+ T cells in the lungs, MLN and spleens are depicted.

