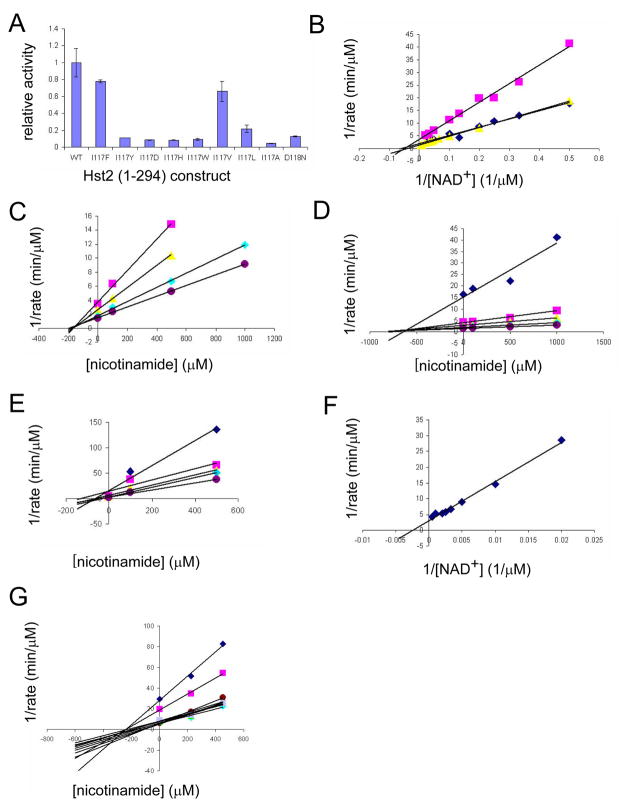
Figure 3. Activity, kinetic, and inhibition data for wild-type and mutant yHst2.
(A) Relative activity of wild-type and mutant yHst2 enzymes based on their ability to deacetylate a fluorescently-labeled acetylated peptide in duplicate. Error bars represent one SD of experiments done at least in triplicate.
(B) Lineweaver-Burk plot describing the NAD+ binding kinetics of wild-type yHst2 (blue diamonds), the yHst2 I117F and I117V mutants (pink squares, yellow triangles, respectively) done in triplicate.
(C) Dixon plot describing the nicotinamide inhibition of wild-type yHst2 at varying concentrations of NAD+, 15 μM (pink squares), 25 μM (yellow triangles), 50 μM (cyan diamonds), and 80 μM (purple circles). Each line is fit to an equation for a noncompetitive inhibitor with obtained in triplicate.
(D) Dixon plot describing the nicotinamide inhibition of yHst2 I117F with conditions as described in (C), but also including 5 μM NAD+ (blue diamonds).
(E) Dixon plot describing the nicotinamide inhibition of yHst2 I117V with conditions as described in (D).
(F) Lineweaver-Burk plot describing the NAD+ binding kinetics of yHst2 D118N (blue diamonds) with data obtained in triplicate.
(G) Dixon plot describing the nicotinamide inhibition of yHst2 D18N at varying concentrations of NAD+, 50 μM (blue diamonds), 100 μM (pink squares), 250 μM (yellow squares), 450 μM (cyan diamonds), 600 μM (purple circles), 800 μM (maroon circles), 1000 μM (blue minus signs), 1250 μM (green triangles), 1500 μM (cyan plus signs), 2000 μM (gray diamonds).

