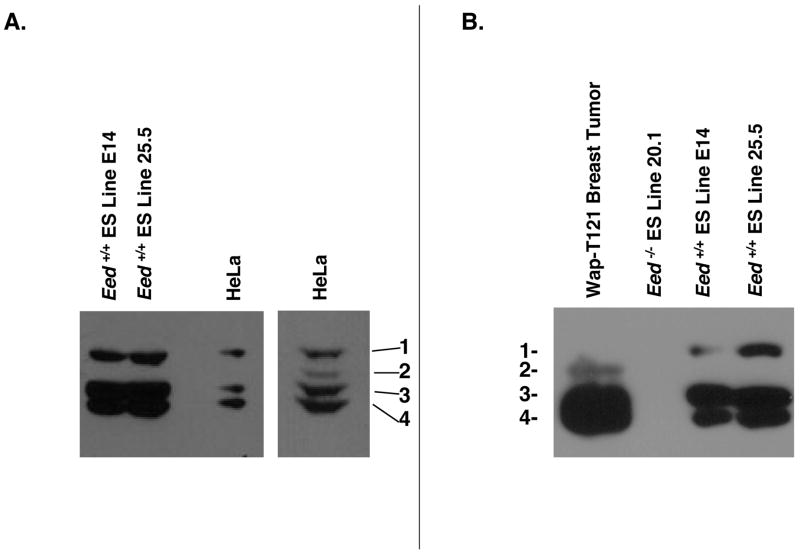
Figure 2. Confirmation of EED isoform identities.
Western blot analysis of EED comparing isoforms observed in embryonic stem cells to isoforms observed in (A) HeLa cells or (B) Mouse Wap-T121 breast tumors. On prolonged exposure, EED-2 becomes visible in HeLa lysates (Aright panel). EED isoforms 1–4 are indicated as 1, 2, 3, and 4.

