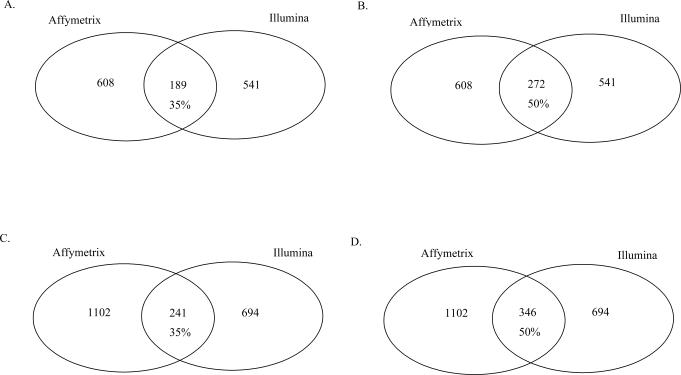
Figure 1.
Concordance between platforms in the identification of genes induced by benzene exposure. The numbers of significant genes (P ≤ 0.05) from the analysis of differential expression performed by t-test/quantile transformation (QT) are shown. A. Genes with fold-change ≥ 1.3-fold on both platforms, based on the stringent comparison data set. B. Genes with an average fold-change ≥ 1.3-fold, based on the stringent comparison data set. C. Genes with a fold-change ≥ 1.3-fold on both platforms, based on the complete data set. D. Genes with an average fold-change ≥ 1.3-fold, based on the complete data set.

