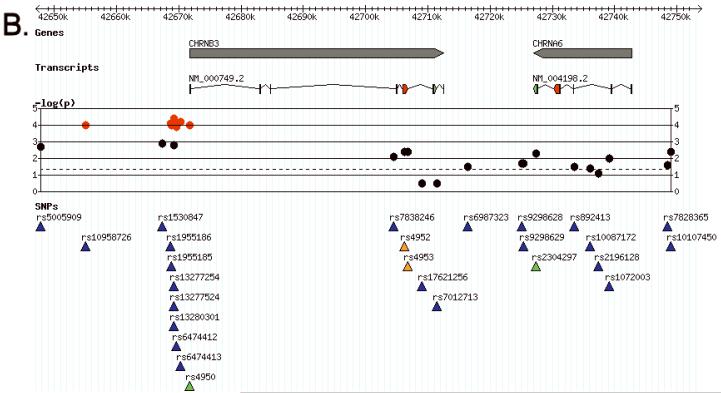
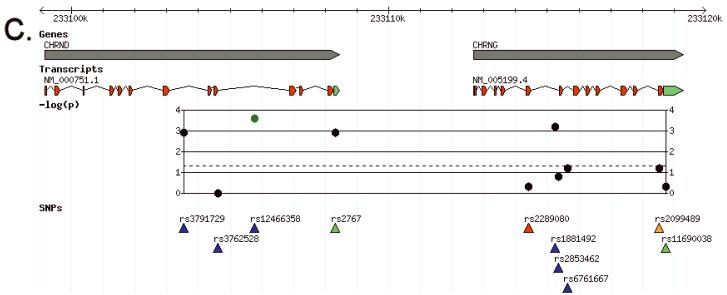
Figure 2.
Association results aligned with genes and transcripts from NCBI. The −log(p) track plots the negative logarithm of the primary p-value, color coded by LD bin: red = bin 1, yellow = bin 2, cyan = bin 3, blue = bin 4, green = bin 5. Panel A: the CHRNA5-CHRNA3-CHRNB4 gene cluster on chromosome 15. Panel B: the CHRNB3-CHRNA6 cluster on chromosome 8. Panel C: CHRND-CHRNG on chromosome 2. Panel D: Key for transcript and SNP function color codings.


