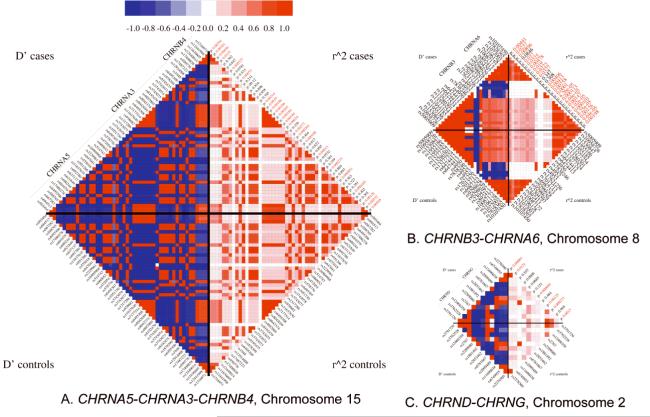
Figure 3.
Linkage disequilibrium plots. Pairwise signed D’ values indicate the phase of LD, so that a positive value denotes coupling (the minor alleles tend to co-occur) and a negative value denotes repulsion (the minor allele at one locus tends to co-occur with the common allele at the other locus). Primary p-values are also displayed. Panel A: CHRNA5-CHRNA3-CHRNB4. Panel B: CHRNB3-CHRNA6. Panel C: CHRND-CHRNG.

