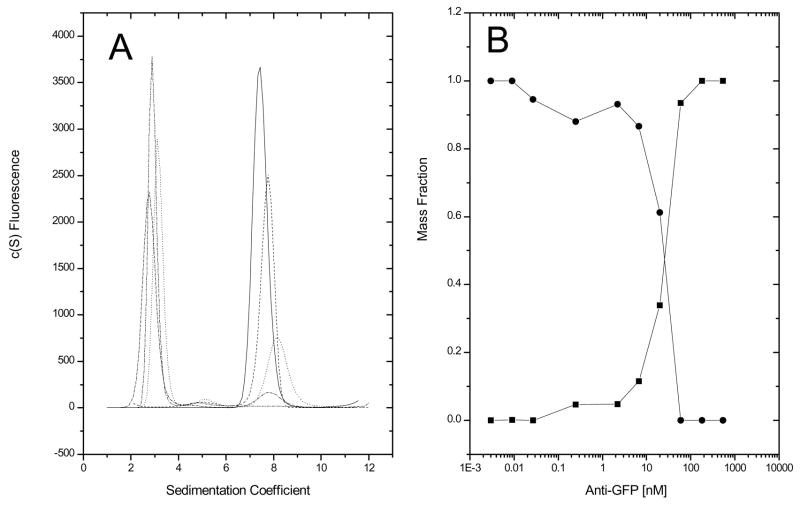
Figure 2.
Overlay of c(s) plots of GFP:anti-GFP titration (panel A). Antibody was serially diluted 1:3 over a concentration range of 540 nM to 0.003 nM in a constant concentration of 40 nM GFP. Mass fraction of GFP (circles) and anti-GFP/GFP (squares) as a function of antibody concentration (panel B).

