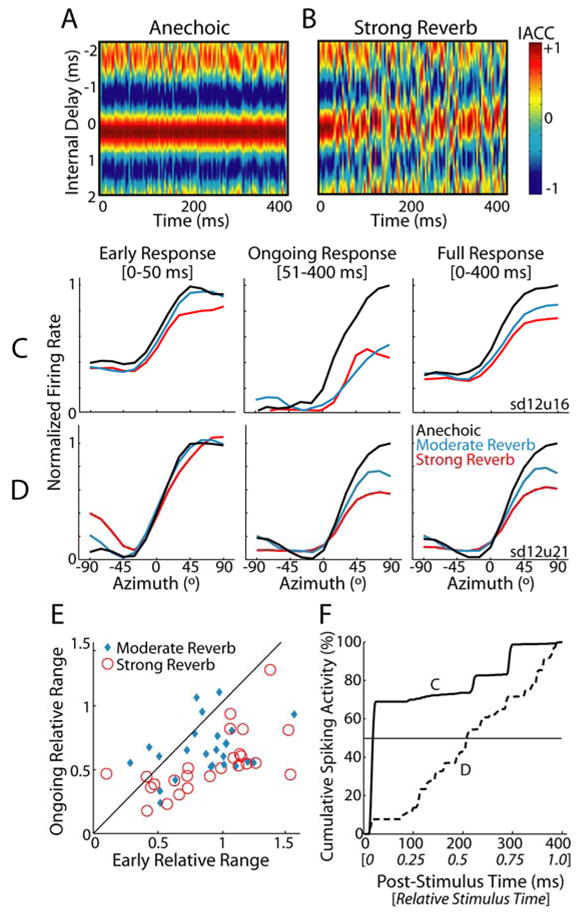
Figure 3. Temporal dynamics of directional sensitivity in reverberation.

A, Short-term IACC across time for the 45° anechoic virtual space stimulus; hot colors indicate high correlation. Ear-input signals were simulated as in Fig. 1B and subsequently bandpass filtered (4th-order Gammatone filter centered at 1000 Hz) to simulate peripheral auditory processing. Short-term IACC was computed using a sliding 4-ms window.
B, Short-term IACC for the 45° strong reverb virtual space stimulus.
C,D Rate-azimuth curves for two IC neurons computed using the early (0–50 msec), ongoing (51–400 msec), and full (0–400 msec) neural responses. To facilitate comparison across time periods, firing rates have been normalized to the maximum anechoic firing rate, separately for each time period. Unit CFs are C, 747 Hz and D, 817 Hz.
E, Ongoing vs. early relative range for IC neuron population. Solid line indicates identity i.e., y=x.
F, Average cumulative peristimulus time histograms (cPSTHs) for the two neurons in panels C (solid line) and D (dashed line).
