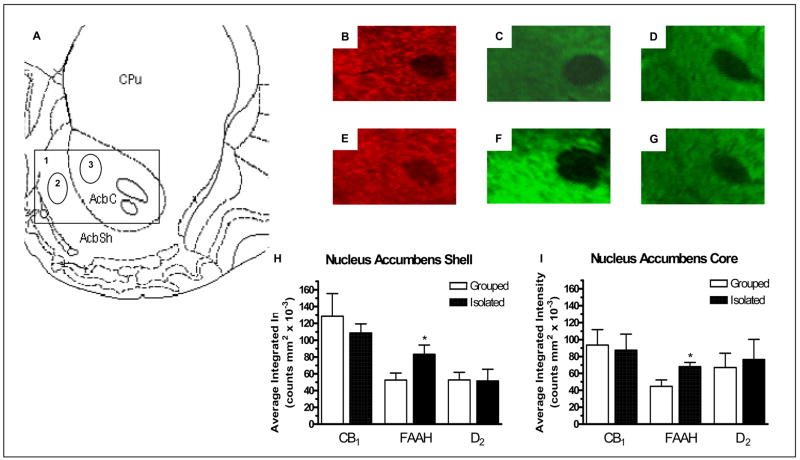
Figure 3.
A) Modified image from Paxinos and Watson (1998) 1.6 mm rostral to bregma showing 1) The area depicted in images B–G, 2) The area measured for intensity of staining for the nucleus accumbens shell and 3) The area measured for intensity of staining for the nucleus accumbens core. Image B, C and D are representative images from group housed ratsshowing: B) CB1 expression, C) FAAH expression and D) D2 expression. Image E, F and G are representative images from socially-isolated rats showing: E) CB1 expression, F) FAAH expression and G) D2 expression. Image H and I show the effect of social isolation on CB1, FAAH and D2 relative fluorescence density of staining in the nucleus accumbens shell and core respectively, compared with group housed rats. * denotes P < 0.05 when compared with group housed rats (n = 7).

