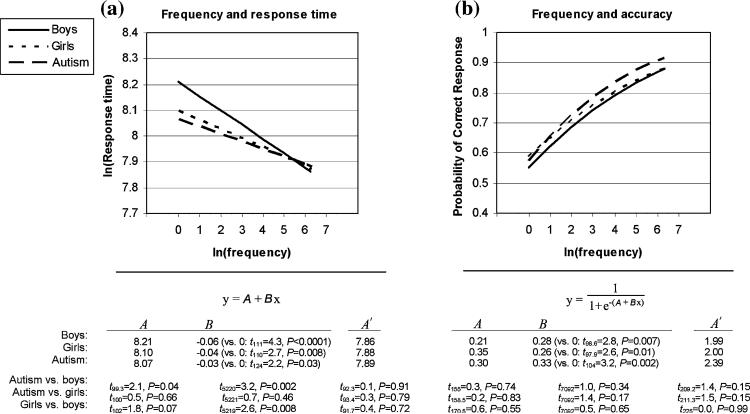
Fig. 1.
Regression line equations and group differences of slopes and high- and low-frequency words for (a) response time; (b) accuracy. Regression lines are shown across the range of picture-name frequencies tested, from ln(frequency) = 0 (lowest-frequency; zero-intercept) to ln(frequency) = 6.30 (highest-frequency). In the equations, A corresponds to the zero-intercept and B to the slope of the regression line. Group differences at the high-frequency endpoint (A′) were examined by resetting the intercept to ln(frequency) = 6.30. Significance was assessed with t-statistics, between groups for A, A′ and B, and between B and zero. All p-values are reported two-tailed, with α = 0.05; degrees of freedom are calculated using the Satterthwaite approximation

