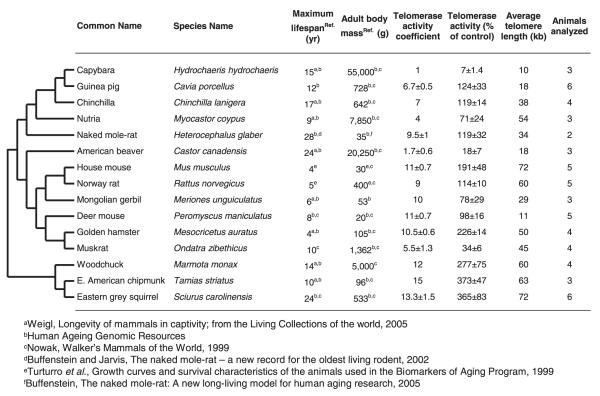
Fig. 1.
Phylogeny and phenotypic data for 15 rodent species. The tree topology is based on molecular phylogenies inferred from (Martin et al., 2000; Michaux et al., 2001; Murphy et al., 2001; Montgelard et al., 2002; Adkins et al., 2003; Steppan et al., 2004). The telomerase activity coefficients, and percentage of telomerase activity for each species are species averages ± SD.

