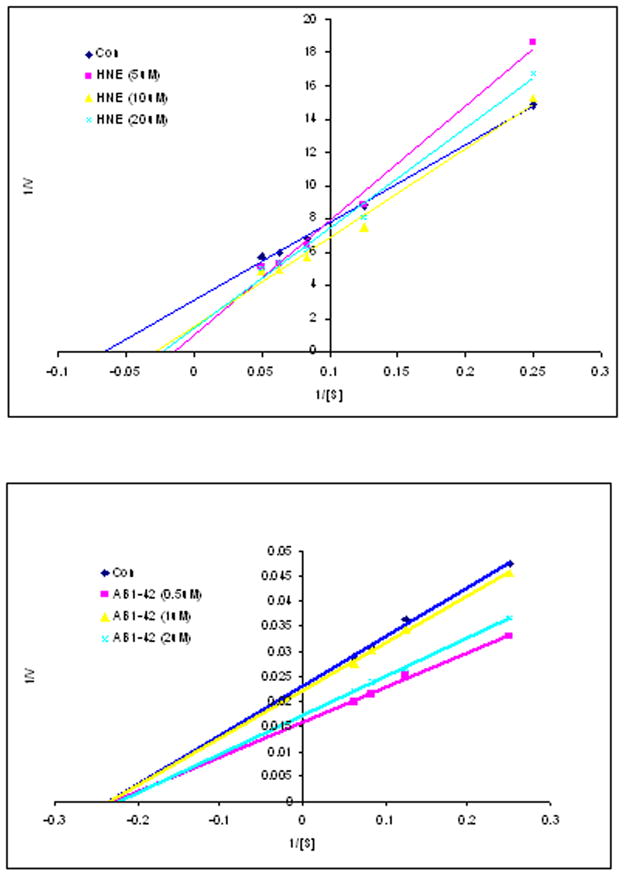
Figure 6.

Lineweaver-Burk double-reciprocal plots in HNE and Aβ1-42 peptide treatment. The graphical plots were conducted at four different concentrations of the fluorogenic peptide substrate V (4–16 μM). Three to five independent experiments were carried out in duplicate.
