Figure 4.
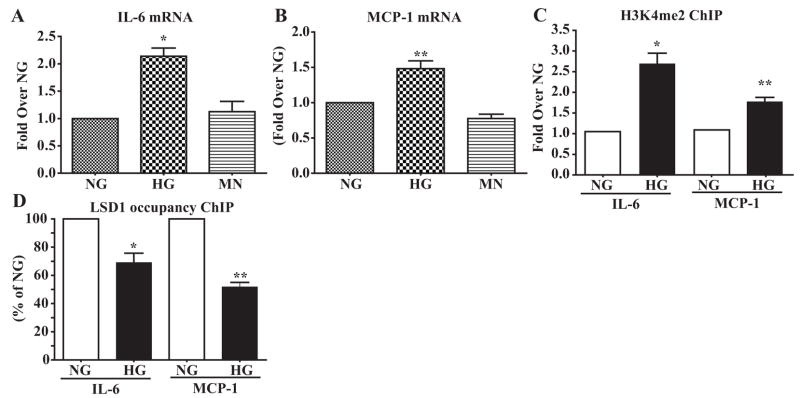
HG effect on inflammatory gene expression, H3K4me2, and LSD1 recruitment. A and B, IL-6 and MCP-1 expression in HVSMCs treated with normal glucose (NG), high glucose (HG), and mannitol (MN). Gene expression was analyzed by RT-QPCR and normalized to β-actin, and results were expressed as fold change over NG (means±SEM). *P<0.05, **P<0.01 vs NG (n=3). C, HVSMCs were subjected to ChIP assays using H3K4me2 antibody, and ChIP-enriched DNA samples were analyzed by QPCR using human IL-6 and MCP-1 promoter primers. Results were normalized to input and expressed as fold change over NG (means±SEM). *P<0.03, **P<0.01vs NG (n=3). D, HVSMC samples were subjected to ChIP assays using LSD1 antibody, and ChIP samples were analyzed by QPCR using human IL-6 and MCP-1 promoter primers. Results were normalized to input and expressed as percentage of NG. *P<0.04, **P<0.004 vs NG (n=3).

