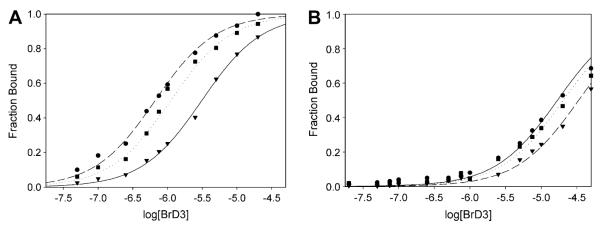
Fig. 2.
Representative binding curves for BrD3 binding to the fluorescein-labeled AcK9 (A) and AcK14 (B) histone H3 peptides. The fluorescence anisotropy of 10 nM fluorescein-labeled H3 peptide is plotted as a function of the log of the nonlabeled BrD3 concentration. (A) BrD3 binding to AcK9 at several salt concentrations and temperatures: ●, 298 K, 0.050 M Na+; ▾, 308 K, 0.050 M Na+; ∎, 298 K, 0.250 M Na+. (B) BrD3 binding to AcK14 at several salt concentrations and temperatures: ●, 298 K, 0.050 M Na+; ▾, 308 K, 0.050 M Na+; ∎, 298 K, 0.250 M Na+. All plots were fit to a two-state binding model.

