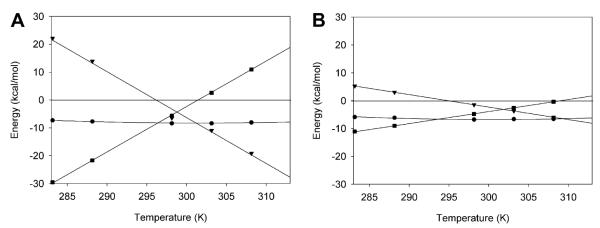
Fig. 4.
Thermodynamic profiles of specific and nonspecific interactions of BrD3. Plots of free energy (●), enthalpy (▾), and entropy (∎) of binding versus temperature are given for AcK9 (A) and AcK14 (B). It should be noted that the entropy is given as —TΔS to present the data with enthalpy and free energy in the same units.

