Figure 3.
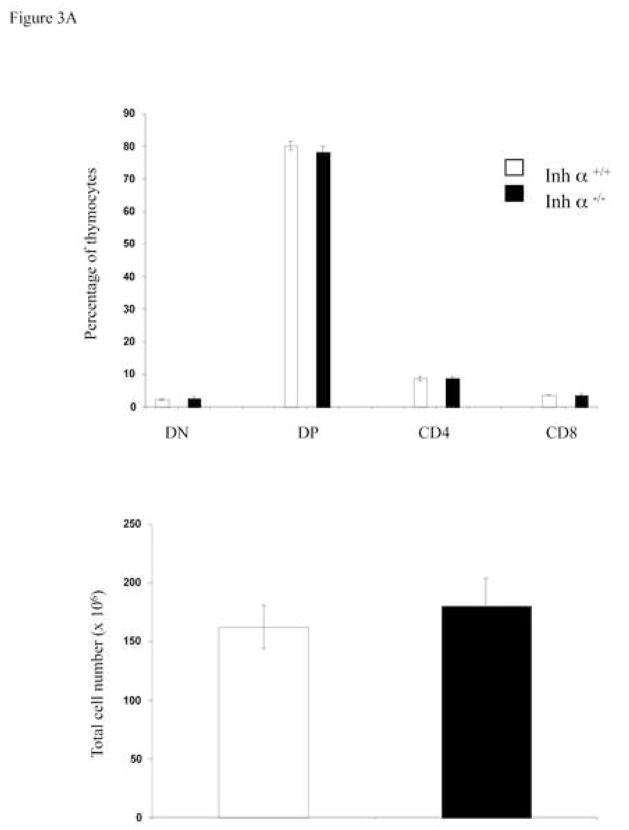
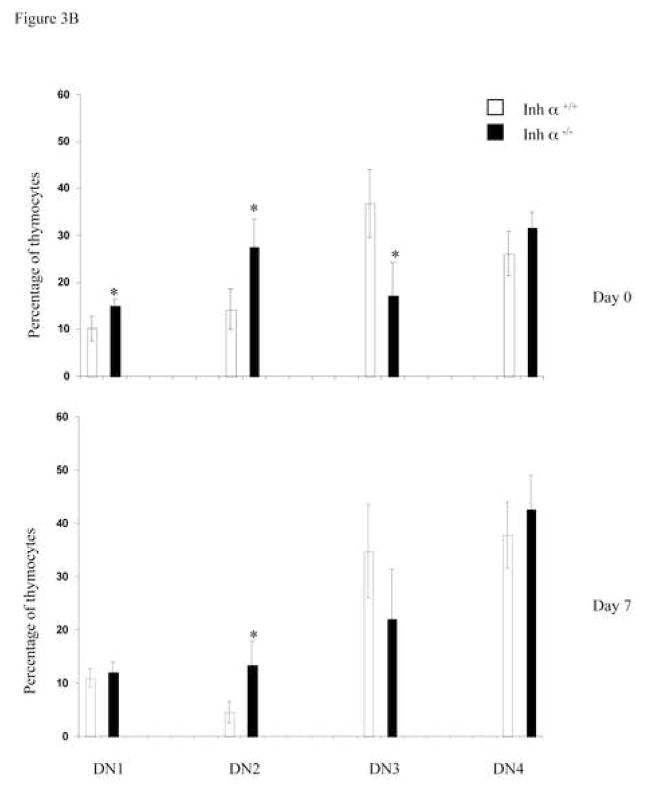
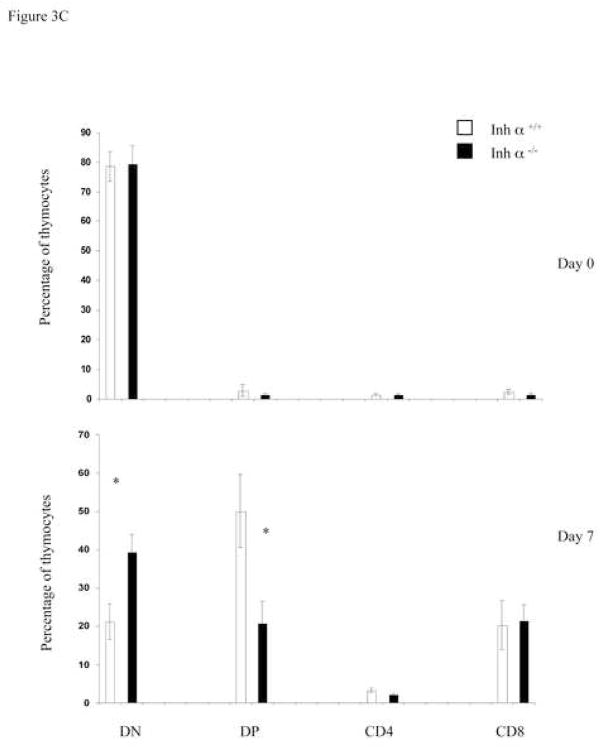
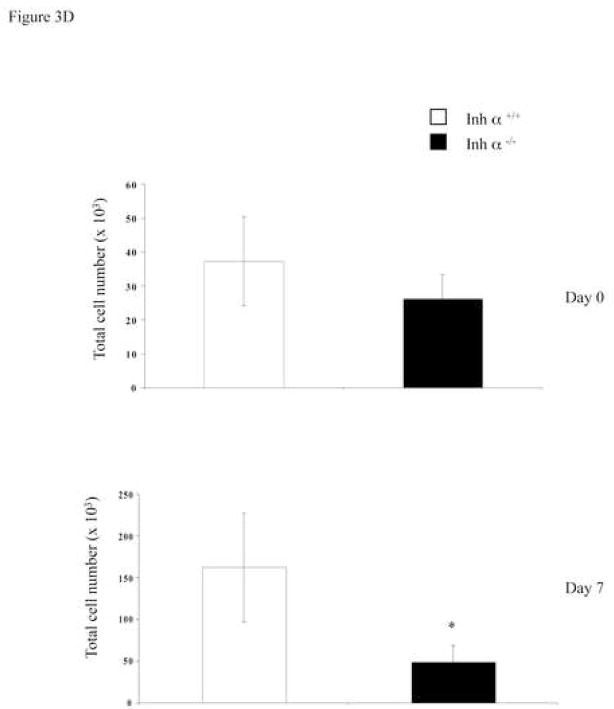
Inhibin α−/− mice show impaired early T cell development. A, Phenotypic analysis of thymocytes from 6–8 week old inhibin α−/− mice and wild type littermates, after staining with anti CD4-PE and anti CD8-Cy coupled antibodies. Data represents percentage and total cell number of thymocytes in inhibin α−/− mice and wild type littermates. The average and standard error of twelve individual mice from six independent experiments is shown. B, and C, E14 FTOC were performed for seven days with thymic lobes from inhibin α−/− mice and control littermates, thymocytes were stained with anti CD44-PE, anti CD25-FITC (B) anti CD4-APC and anti CD8-Cy (C). D, Total thymocyte numbers obtained from inhibin α−/− or wild type FTOC at day 0 and day 7 of culture. The average and standard error of seven individual mice, from four independent experiments is shown. * Statistical differences (p ≤ 0.1) using unpaired T-test.


