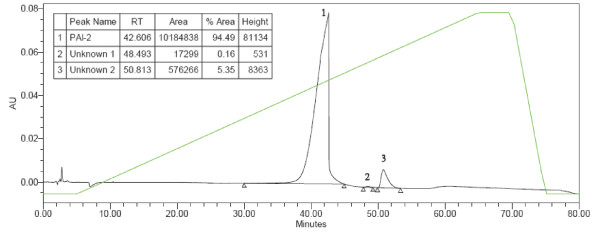
Figure 2.
Quantitative analysis of the purification of PAI-2 ΔCD-loop from pQE9. Protein (100 μL) was injected onto a cation exchange column and eluted using a linear NaCl gradient (0–1 M) at 1 mL/min. PAI-2 ΔCD-loop was detected at 280 nm with a RT of 42.606 min. Integration of the peak corresponding to PAI-2 ΔCD-loop measured the purity at 94.5%. The green line indicates the relative amount of buffer B (MES pH 5.0, 1 M NaCl) to buffer A (MES pH 5.0). Insert: Relative retention times hatand purity as calculated from AUC using Empower Pro V2 (Waters) software. RT = retention time.

