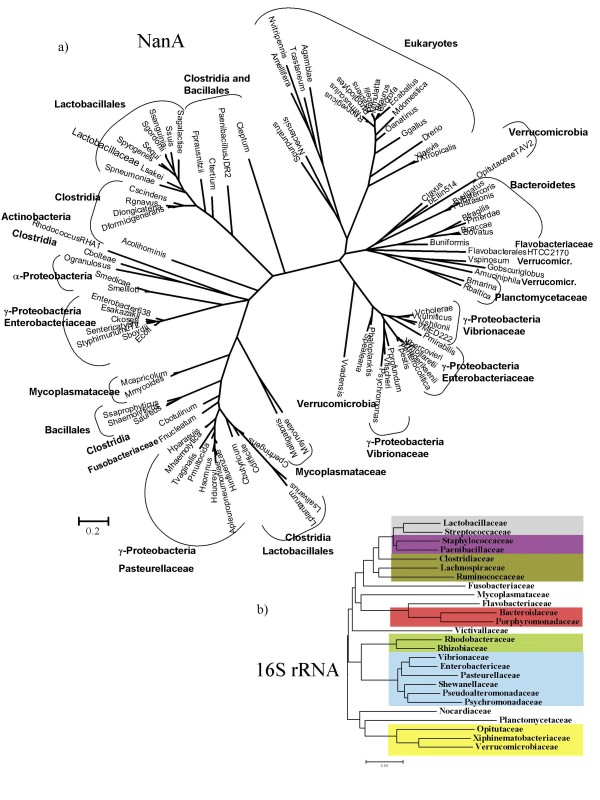
Figure 4.
Phylogenetic trees of a) All species encoding NanA b) 16S rRNA of all families encoding NanA. The trees were obtained using Bayesian analysis as implemented in MrBayes. 1,000,000 generations were used to build the consensus trees as indicated in methods section. Main inclusive taxonomic groups are indicated. b) Grey shading, Lactobacillales; purple shading, Bacillales; dark green shading, Clostridia; red shading, Bacteroidetes; green shading, Alpha-proteobacteria; blue shading, Gamma-proteobacteria; yellow shading, Verrucomicrobia.

