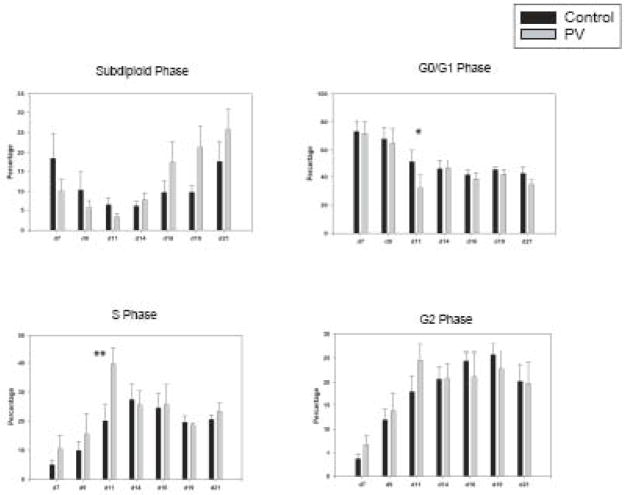
Figure 3. PV erythroid progenitors at day 11 contained high proportion of S phase cells than control progenitors.
Apoptosis (Sub-diploid) and cell cycle phase were analyzed using propidium iodide staining. Data are presented as the mean plus standard error. The statistical significance between control and PV erythroid cells was calculated by Student’s t-test. PV-polycythemia vera, d-day, * and ** represent p <0.05 and p <0.01, respectively.

