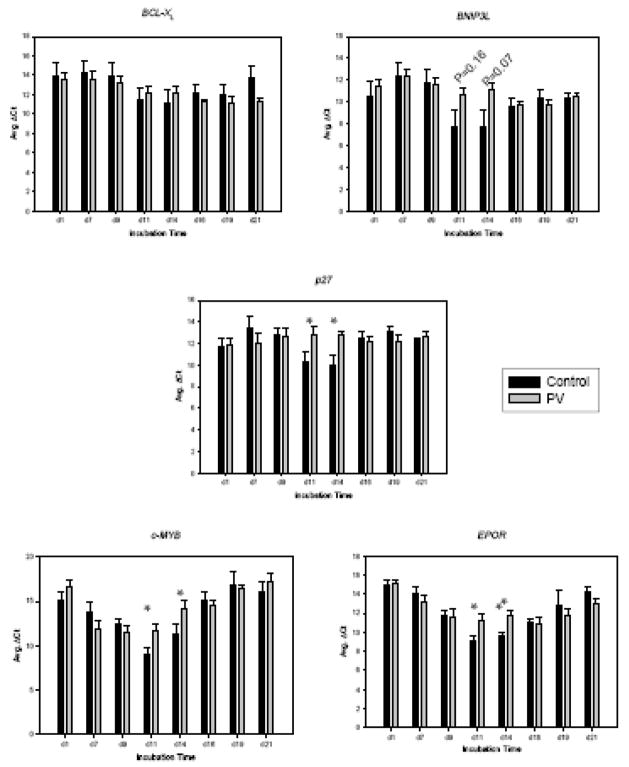
Figure 4. Differential expression of apoptotic and cell cycle regulators at specific stages of PV erythropoiesis.
The expression levels of selected genes were tested during normal and PV erythropoiesis using qRT-PCR. Means of ΔCT with standard error were shown in Y-axis. Data are presented as the mean plus standard error. The statistical significance between control and PV erythroid cells was calculated by Student’s t-test. PV-polycythemia vera, d-day, * and ** represent p <0.05 and p <0.01, respectively. Relative expressions of particular genes as indicated were normalized against the level at day 1.

