Figure 1.
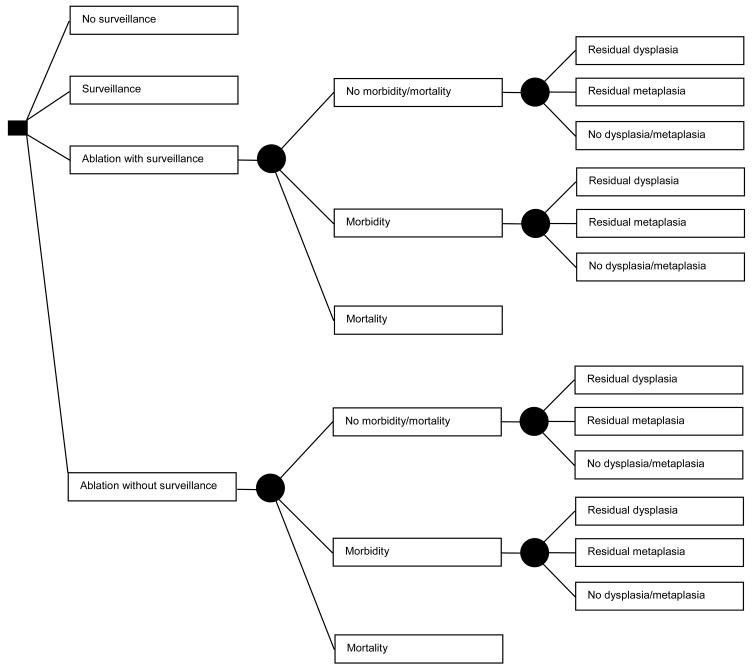
Figure 1A. Decision Tree: Patient options at the decision node (square) include: no surveillance, surveillance, ablation with surveillance for all patients, or ablation without surveillance for those in whom complete ablation of metaplasia is achieved. Among patients treated with ablation, complications leading to either morbidity or mortality may occur, dictated by the probabilities at the chance nodes (circles). Mortality results in termination of the simulation. All other patients may have persistent dysplasia, no dysplasia but persistent metaplasia, or complete ablation of dysplasia and metaplasia, dictated by the probabilities at the chance nodes, which differ according to patient category (high-grade, low-grade or no dysplasia) and ablation type. Patients not experiencing mortality from ablation enter the Markov Model (Figure 1B), as do patients who are managed by the surveillance or no surveillance strategies.
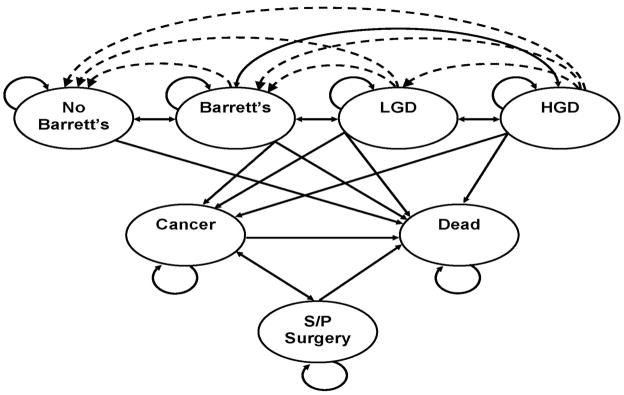
Figure 1B. Markov Model: Patients can reside in one of seven major states: Patients without Barrett’s esophagus (BE); patients with BE, without dysplasia or cancer; patients with BE and low-grade dysplasia (LGD); patients with BE and high-grade dysplasia (HGD); patients with adenocarcinoma of the esophagus; patients who have had esophagectomy; and death from adenocarcinoma of the esophagus, complications of surgery, endoscopy, or other causes. The arrows indicate the possible transitions from one state to another in each cycle. Dashed lines indicate transition allowed only with ablative therapies.


