
Figure 3.
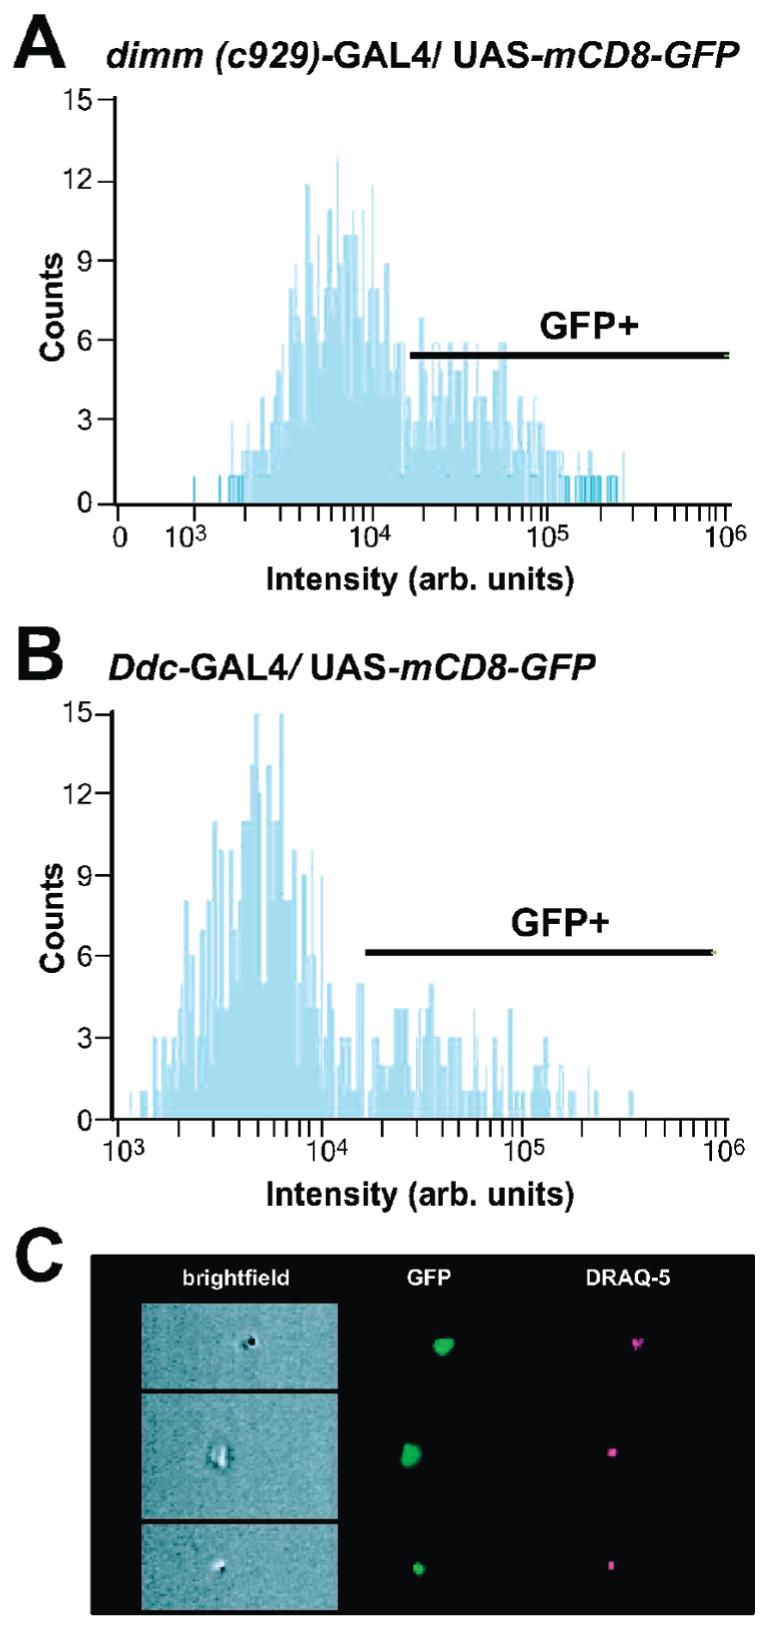
The efficiency of the immunoaffinity enrichment method was assessed by FACS analysis. The histograms demonstrate the counts of DRAQ5-positive cells expressing GFP in cell suspension after immunoaffinity enrichment. With the use of the dimm (c929)-GAL4 driver, 55% of the cells were GFP-positive (A). The line indicates the gate intensity threshold for GFP-positive fluorescence. With the use of the Ddc-GAL4 driver, 35% of the cells were GFP-positive (B). Live cells were distinguished from necrotic cells using an imaging flow cytometer which provided simultaneous analysis of morphological features (brightfield illumination), GFP fluorescence (green), and DRAQ5 staining (red). Representative images of cells isolated with the dimm (c929)-GAL4 driver are shown (C).