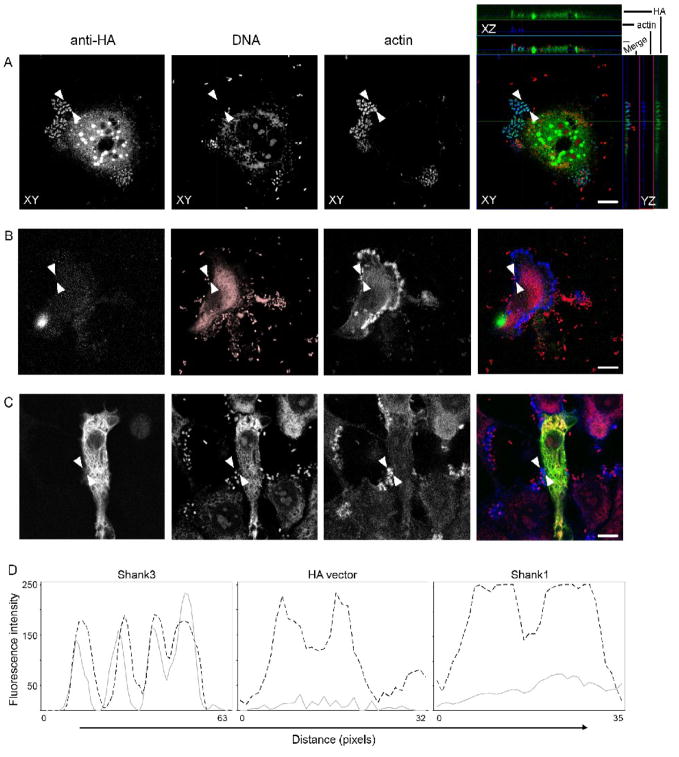
Figure 1. Shank3 is recruited to the EPEC pedestal.
HeLa cells were transfected with either Shank3-HA (A), HA vector alone (B) or Shank1-HA (C). After 24 hours cells were infected with EPEC for four hours, washed, fixed and stained using anti-HA antibodies, propidium iodide and phalloidin. Anti-HA (green in merge), DNA (red in merge) and actin (blue in merge) are shown, as single plane maximum projections, with orthogonal projections in the case of Shank3-HA, of confocal z-stacks. Scale bars represent 10 μm. (D) Fluorescent intensity profiles of actin (dotted line) and anti-HA (grey line) staining are shown. Pedestal profiles were drawn as straight lines between the arrowheads shown in the micrographs. In contrast to the colocalisation seen with Shank3 (A), HA or Shank1 (B and C) staining are both largely absent staining beneath attached bacteria.

